
Philadelphia Owns the Numbers, Denver Owns the Model's Edge
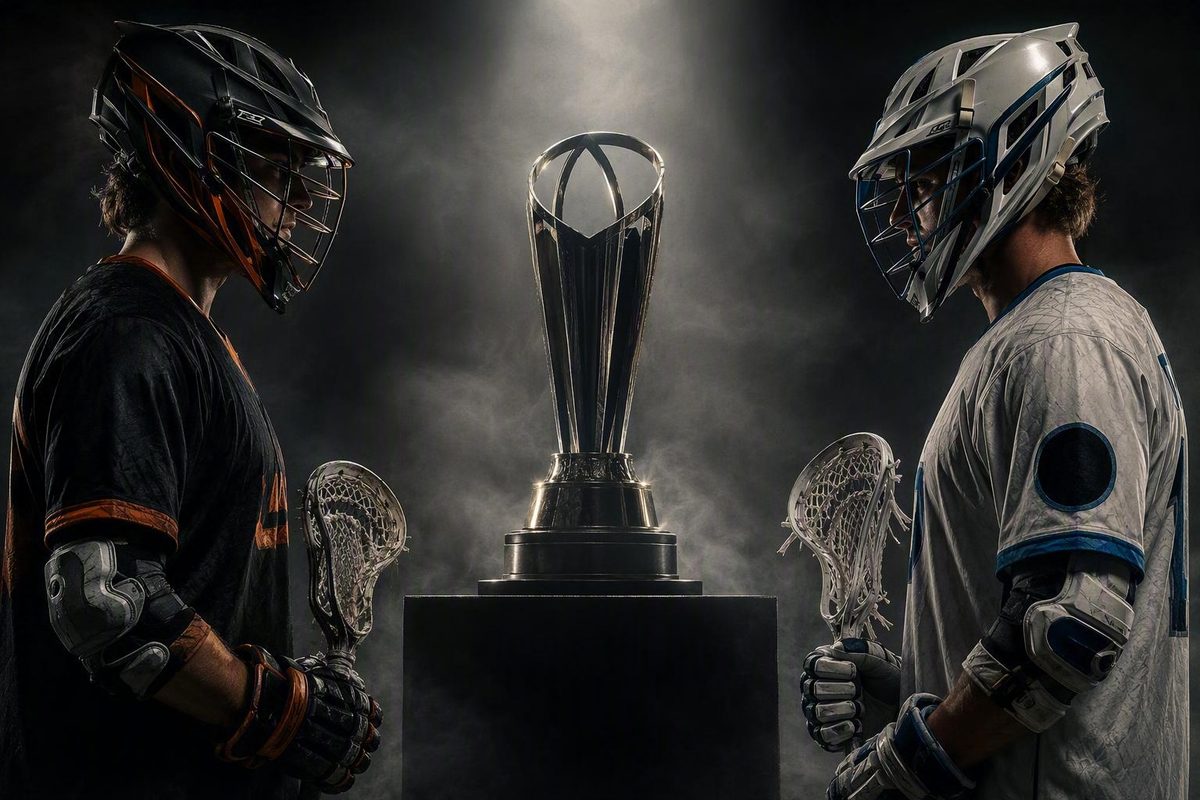
Pregame Outlaws vs. Waterdogs numbers for the Sept. 20 PLL final: team rates, Sowers and Kirst vs. O'Neill, faceoff and goalie lines, and the 51-49 model split.
The 2026 PLL Championship between the Denver Outlaws and Philadelphia Waterdogs kicks off Sunday, September 20, at 12:30 p.m. ET at Sports Illustrated Stadium in Harrison, New Jersey, so there is no final score, scoring sequence or championship box score yet. On the pregame numbers, Philadelphia (9-3) is the better team in every listed category: 12.6 scores per game to Denver’s 11.5, a +14 scoring differential to Denver’s -6, a 53.1% team faceoff rate to 49.5%, a 57.6% team save rate to 51.5%, and an 18-8 win over the Outlaws on July 25. The PLL Labs pregame model still calls it Denver 51%, Philadelphia 49%. Every figure here is a 2026 season, head-to-head or semifinal statistic, not a championship-game number.
Pick a category; the Denver and Philadelphia lines and the edge update below.
Outlaws vs. Waterdogs: Pregame Comparison by Category
2026 Pregame Team Statistics
| Metric | DEN | PHI | Edge |
|---|---|---|---|
| Record | 6-6 | 9-3 | PHI |
| Scores per game | 11.5 | 12.6 | PHI |
| Scores allowed per game | 12.0 | 11.4 | PHI |
| Total scores | 138 | 151 | PHI |
| Shooting rate | 26.8% | 27.8% | PHI |
| Shots per game | 38.8 | 41.7 | PHI |
| Team faceoff rate | 49.5% | 53.1% | PHI |
| Team save rate | 51.5% | 57.6% | PHI |
| Scoring differential | -6 | +14 | PHI |
DEN = Denver Outlaws, PHI = Philadelphia Waterdogs. The matchup page does not state whether totals include the semifinals.
Listed Scoring Leaders
| Player | Team | Pts | Selected line |
|---|---|---|---|
| Michael Sowers | PHI | 51 | 22 assists |
| CJ Kirst | PHI | 39 | 34 one-point goals in 10 games; PLL single-season record, passed Holman's 30 |
| Brennan O'Neill | DEN | 35 | 19 assists |
| Pat Kavanagh | DEN | 20 | 11 one-point goals, 7 assists, 35.3% shooting in 6 games |
Points combine credited goals and assists. Games played are not listed for every player, so these are totals, not rates.
Faceoff and Goalie Lines
| Matchup | Denver | Philadelphia |
|---|---|---|
| Team faceoff rate | 49.5% | 53.1% |
| Listed specialist | Luke Wierman 51.6% over 287 | Alec Stathakis 57.4% over 176 |
| Primary listed goalie | Logan McNaney 49.3% saves, 12.4 SAA | Sean Byrne 62.3% saves, 10.0 SAA, 86 saves in 7 games |
| Other listed goalie | Owen McElroy 59.6% saves, 10.4 SAA | — |
| Semifinal goalie line | McNaney 11 saves, 68.8% | Byrne 14 saves |
Team faceoff rates can include several specialists, so an individual rate does not replace the team figure.
Recent Meetings
| Season | Result | Winner |
|---|---|---|
| 2024 | Denver 15-13 Philadelphia | DEN |
| 2025 | Denver 9-7 Philadelphia | DEN |
| July 25, 2026 | Philadelphia 18-8 Denver | PHI |
| July 25, 2026 phase | DEN | PHI |
|---|---|---|
| Shooting | 23% | 39% |
| Faceoffs | 41% | 56% |
| Saves | 36% | 68% |
Semifinal Results
| Team | Result | Key lines |
|---|---|---|
| Denver | 11-5 vs. Utah | 9-1 at half; 12 first-half turnovers forced; Utah held to 4 first-half shots on goal; O'Neill and Kavanagh 4 points each; McNaney 11 saves, 68.8% |
| Philadelphia | 13-10 vs. Boston | Kirst 3 goals, 2 assists; Kyle Lewis hat trick; Byrne 14 saves; six rookies combined for 7 goals; first final since 2023 |
Sources: official PLL 2026 championship matchup page and schedule; USA Lacrosse Week 12 recap; Yahoo Sports semifinal reports. All figures pregame as of Sept. 17, 2026; no championship-game numbers exist yet.
Game Details and the Records Behind the Comparison
The official PLL postseason schedule lists the championship for September 20 at 12:30 p.m. ET, with Denver against Philadelphia on ABC and the ESPN App. ESPN’s playoff coverage confirms Sports Illustrated Stadium as the venue and ABC as the network.
| Game detail | Information |
|---|---|
| Matchup | Denver Outlaws vs. Philadelphia Waterdogs |
| Date and time | Sunday, September 20, 2026, 12:30 p.m. ET |
| Venue | Sports Illustrated Stadium, Harrison, New Jersey |
| Broadcast | ABC and the ESPN App |
| Pregame records | Denver 6-6; Philadelphia 9-3 |
The records used throughout are Denver 6-6 and Philadelphia 9-3, as shown on the league’s matchup and standings pages. One league schedule display places undefined “6-12” and “9-6” figures beside the teams; those are not the pregame records and are not used here.
Philadelphia Leads All Nine Team Categories
| Metric | Denver | Philadelphia | Edge |
|---|---|---|---|
| Record | 6-6 | 9-3 | Philadelphia |
| Scores per game | 11.5 | 12.6 | Philadelphia |
| Scores allowed per game | 12.0 | 11.4 | Philadelphia |
| Total scores | 138 | 151 | Philadelphia |
| Shooting rate | 26.8% | 27.8% | Philadelphia |
| Shots per game | 38.8 | 41.7 | Philadelphia |
| Team faceoff rate | 49.5% | 53.1% | Philadelphia |
| Team save rate | 51.5% | 57.6% | Philadelphia |
| Scoring differential | -6 | +14 | Philadelphia |
The figures are the official PLL matchup page’s displayed 2026 pregame statistics. The page does not consistently say whether each total is regular-season-only or includes the semifinals, so “2026 pregame” is the accurate label.
Philadelphia has produced 13 more scores and allowed seven fewer, a 20-point gap in scoring differential. Its 1.1-score-per-game edge rests on both a higher shooting rate and nearly three more shots per game. The faceoff and save-rate gaps extend the advantage to both ends of a possession: more possessions won, fewer opposing shots converted.
None of that settles a one-game final. A short faceoff run, a two-point goal, a cluster of turnovers or one hot goalie quarter can outweigh season-level margins. The table makes Philadelphia the stronger observed team entering the game, not the champion.
Sowers, Kirst, O’Neill and Kavanagh on the Pregame Leaderboard
Philadelphia’s offense runs on two different kinds of production. Michael Sowers carries the larger points and assists totals; CJ Kirst has the matchup’s highest one-point-goal total. Brennan O’Neill leads Denver in points and assists, with Pat Kavanagh the second listed option.
| Player | Team | Points | Selected production |
|---|---|---|---|
| Michael Sowers | Philadelphia | 51 | 22 assists |
| CJ Kirst | Philadelphia | 39 | 34 one-point goals; 10 games |
| Brennan O’Neill | Denver | 35 | 19 assists |
| Pat Kavanagh | Denver | 20 | 11 one-point goals; 7 assists; 35.3% shooting; 6 games |
A player’s statistical points total combines credited goals and assists, so one-point goals, two-point value, assists and points keep the league’s labels here rather than being merged. Kavanagh’s line shows why: 20 points, 11 one-point goals and seven assists cannot be reconciled from those categories alone without inventing an unlisted one, so his totals are reported as displayed.
Kirst’s 34 one-point goals match the USA Lacrosse report that he finished the regular season with a PLL single-season record of 34 goals, passing Marcus Holman’s 30. A narrative blurb on the matchup page refers to the record falling at 23; its scope is unexplained and cannot be reconciled with the official 34-goal listing, so 34 stands. Kirst added three goals and two assists in the semifinal.
Games played differ: Kirst’s line covers 10 games and Kavanagh’s six, and the compact leader display does not give a figure for every player. These are leaderboard totals, not equal-sample rate comparisons.
Faceoff and Goalie Lines Favor Philadelphia, With One Denver Caveat
Philadelphia enters at 53.1% on team faceoffs to Denver’s 49.5%. The specialist comparison points the same way: Alec Stathakis is listed at 57.4% over 176 faceoffs, Luke Wierman at 51.6% over 287, per the official matchup display. A team rate can include attempts by several specialists, so Wierman’s 51.6% does not replace Denver’s 49.5% team figure, and Wierman’s larger sample does not make the two individual rates equivalent.
| Matchup | Denver | Philadelphia |
|---|---|---|
| Team faceoff rate | 49.5% | 53.1% |
| Listed specialist | Luke Wierman: 51.6% over 287 | Alec Stathakis: 57.4% over 176 |
| Primary listed goalie | Logan McNaney: 49.3% saves, 12.4 SAA | Sean Byrne: 62.3% saves, 10.0 SAA |
| Other listed goalie | Owen McElroy: 59.6% saves, 10.4 SAA | — |
Sean Byrne’s listed line is a 62.3% save rate, a 10.0 scores-against average and 86 saves over seven games. Denver’s two displayed goalies are far apart: Logan McNaney at 49.3% and 12.4, Owen McElroy at 59.6% and 10.4. The pregame evidence does not say which one starts Sunday, and no starter should be inferred from the comparison page.
McNaney’s recent ceiling is much higher than his season rate. He made 11 saves at a season-high 68.8% in the semifinal against Utah, per the report on Denver’s 11-5 win. One playoff game does not erase the season rate, but it shows how fast this matchup can flip.
The possession battle reduces to two questions: whether Philadelphia keeps its faceoff edge, and whether Denver gets semifinal-level goaltending. If the Waterdogs win both, their extra shot volume becomes hard to contain.
The July 25 Result Flipped a Series Denver Had Led
Denver won the two previous meetings before Philadelphia reversed the matchup in 2026.
| Season | Result | Winner |
|---|---|---|
| 2024 | Denver 15-13 Philadelphia | Denver |
| 2025 | Denver 9-7 Philadelphia | Denver |
| July 25, 2026 | Philadelphia 18-8 Denver | Philadelphia |
All three results appear on the official matchup comparison. The 18-8 margin is 10 points in the league’s scoring format and is the most relevant benchmark because it came this season. The phase numbers were as lopsided as the score: Philadelphia led 39%-23% in shooting, 56%-41% at the faceoff X and 68%-36% in saves.
Denver’s 15-13 win in 2024 and 9-7 win in 2025 give the Outlaws two of the last three, so the series is not one-sided. Philadelphia owns the latest result and by far the largest margin, and it showed it can control this matchup in every phase. It does not follow that those margins recur in the final, especially after what Denver did to Utah.
How Denver and Philadelphia Won Their Semifinals
Denver beat top-seeded Utah 11-5 on September 7. The Outlaws led 9-1 at halftime after forcing 12 first-half turnovers and holding the Archers to four first-half shots on goal; O’Neill and Kavanagh had four points each, and McNaney made 11 saves at 68.8%.
Philadelphia beat Boston 13-10 the same day. Kirst had three goals and two assists, Kyle Lewis scored a hat trick and Byrne made 14 saves in his first playoff start. Six Waterdogs rookies made their playoff debuts and combined for seven goals, per the Philadelphia-Boston semifinal account, more than half of the team’s 13 scores. The win put Philadelphia back in the championship for the first time since 2023.
The contrast is informative but not predictive. Denver created separation through early defensive pressure and turnovers; Philadelphia advanced on depth plus its established leaders. Philadelphia may handle pressure differently from Utah, and Denver’s defense and goaltending pose different problems from Boston’s.
Why PLL Labs Leans Denver Despite Philadelphia’s Numbers
Philadelphia holds the better record, differential, scoring average, shooting rate, faceoff rate, save rate and 2026 head-to-head result. PLL Labs still gives Denver a 51% pregame win probability to Philadelphia’s 49% on the official championship matchup page. That is a model estimate, not a result or a betting line.
The matchup display does not disclose the inputs behind Denver’s edge. Roster value, playoff weighting, opponent strength or something else could be responsible; the page does not say, so any explanation is speculation. The practical reading: the model treats the final as a near coin flip despite the visible gap.
Three swing areas decide whether the ledger or the model is right:
- Denver’s turnover pressure. Twelve forced turnovers in one half against Utah. Repeating that cuts the settled possessions Sowers and Kirst get.
- Philadelphia’s faceoff and save-rate edges. Holding both feeds a higher-scoring offense and limits Denver’s efficiency.
- Denver’s goalie choice. McNaney has the stronger recent game, McElroy the better season line, and the evidence does not confirm who starts.
Philadelphia enters with the stronger profile and the season’s decisive head-to-head win. Denver’s semifinal defense and the model’s near-even number keep the final hard to call. A postgame version follows once the official final score and championship box score exist.